Salinity in an Estuary
Estuaries are coastal areas where rivers mix with seawater in semi-enclosed basins. Under laboratory conditions, pure water contains only oxygen and hydrogen atoms, but in the real world, many substances are often dissolved in water, like salt. Salinity is the concentration of salt in water, usually measured in parts per thousand (ppt). The salinity of seawater in the open ocean is remarkably constant at about 35 ppt. Salinity in an estuary varies according to one's location in the estuary, the daily tides, and the volume of fresh water flowing into the estuary.Hydrodynamic processes ensue when light freshwater meets heavy seawater, and these processes both concentrate suspended solids and aquatic organisms, and comprise the estuarine habitat that supports multiple life stages for a diversity of fishes.
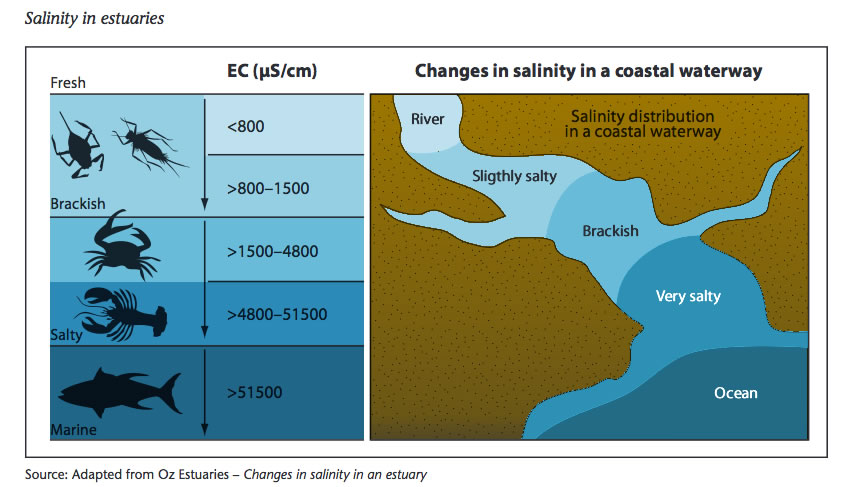

In estuaries, salinity levels are generally highest near the mouth of a river where the ocean water enters, and lowest upstream where freshwater flows in. Actual salinities vary throughout the tidal cycle, however. Salinity levels in estuaries typically decline in the spring when snowmelt and rain increase the freshwater flow from streams and groundwater. Salinity levels usually rise during the summer when higher temperatures increase levels of evaporation in the estuary.
Estuarine organisms have different tolerances and responses to salinity changes. Many bottom-dwelling animals, like oysters and crabs, can tolerate some change in salinity, but salinities outside an acceptable range will negatively affect their growth and reproduction, and ultimately, their survival.
Salinity also affects chemical conditions within the estuary, particularly levels of dissolved oxygen in the water. The amount of oxygen that can dissolve in water, or solubility, decreases as salinity increases. The solubility of oxygen in seawater is about 20 percent less than it is in fresh water at the same temperature.
Salinity In the Bay Delta
The San Francisco Bay/Sacramento-San Joaquin Delta Estuary (Bay Delta) is the largest estuary on the west coasts of North and South America, draining 40% of California’s land area and encompassing the 478-square mile Bay, and the 1,153-square mile Delta.

Caption:Historical Salinity 1944-1990.
Delta flows can be divided into three categories: (1) river and floodplain flows, (2) in-Delta net channel flows, and (3) net Delta outflows.12 The State Water Resource Control Board’s (SWRCB’s) Bay-Delta Water Quality Control Plan (Bay-Delta Plan) identifies water quality objectives to protect beneficial uses of the Bay and Delta, and an implementation program including control of salinity (caused by saltwater intrusion, municipal discharges, and agricultural drainage) through water projects operations. The timing and distribution of salinity is primarily affected by flow, which is largely determined by water management in the Delta and its watersheds as determined by applicable flow objectives. The SWRCB is responsible for ensuring protection of beneficial uses through regulation of pollutant discharges, and regulation of water diversions and flows under their water rights authority.Water quality is strongly connected to water supply, as reservoir releases to control salinity can reduce the availability of fresh water at times of the year when it is needed most.

Caption:The degree to which fresh water and saltwater mix in an estuary is measured using isohalines. Isohalines are areas in the water that have equal salt concentrations, or salinities. In estuaries, salinity levels are generally highest near the mouth of a river where the ocean water enters, and lowest upstream where fresh water flows in. To determine isohalines, scientists measure the water's salinity at various depths in different parts of the estuary. They record these salinity measurements as individual data points. Contour lines are drawn connecting data points that have the same salinity measurements. These contour lines showing the boundaries of areas of equal salinity, or isohalines, are then plotted onto a map of the estuary. The shape of the isohalines tells scientists about the type of water circulation in that estuary.
The data dashboard below provides you with daily data for salinity and other related conditions in the Sacramento San Joaquin Delta. Data is displayed as visualizations, graphs, data tables and more. All data is available for download. Data is provided by the following agencies daily operations:
USGS and California Department of Water Resources (real-time data aggregated by CDEC), California Department of Fish and Wildlife (species data), United States Bureau of Reclamation (water project operations), Interagency Ecological Program (environmental data), Cal Atlas (GIS data).